Introduction Link to heading
In Part 2, we rendered our recorded audio buffer onto an Ebitengine canvas. However, our MinMax algorithm compacted many samples into much less pixels effectively losing resolution.
Before we dive into calculating the spectrum (FFT), let’s make our waveform interactive. In this part, we will introduce a Viewport to handle zooming and scrolling, and add time/magnitude axes to give our data visual context.
The Viewport and Peak Calculation Link to heading
Redrawing 240,000 samples on every frame while zooming would be expensive. Instead, we introduce a Viewport structure to manage our current view state and pre-calculate our waveform peaks.
type Peak struct {
	min float32
	max float32
}

type Viewport struct {
	zoom           int
	scrollPosition int
	scrollSpeed    int
	peaks          []Peak
}
Whenever the zoom level changes, CalculatePeaks() recalculates the minimum and maximum values for the newly scaled pixel columns. This keeps our rendering loop fast, as Draw() only needs to connect the pre-calculated peaks for the visible screen area.
Handling User Input Link to heading
Ebitengine makes handling keyboard input pretty simple inside the Update() loop. We use the up/down arrow keys to modify the zoom multiplier, and the left/right arrows to scroll across the buffer.
if inpututil.IsKeyJustPressed(ebiten.KeyArrowUp) {
    if g.viewport.zoom < 32 {
        g.viewport.zoom *= 2
        g.viewport.scrollPosition *= 2
        zoomChanged = true
    }
}
By tracking zoomChanged and scrollChanged booleans, we only trigger a full canvas redraw (g.FillCanvas()) when the user actually interacts with the window, saving CPU cycles.
Adding Visual Context (Axes) Link to heading
A waveform isn’t very useful without knowing the time or amplitude. We split the rendering into modular functions: generateHorizontalAxis() and generateVertialAxis().
Using ebitenutil.DebugPrintAt, we overlay a dynamic grid:
- Vertical: Fixed at typical normalized magnitudes (-1.0 to 1.0).
- Horizontal: Dynamically calculates pixels-per-second based on the current
zoomlevel, adjusting the grid step (1.0s, 0.5s, or 0.1s) so the screen doesn’t get cluttered when zoomed in.
Putting It Together Link to heading
Our new FillCanvas method neatly stacks these layers:
func (g *Game) FillCanvas() {
	centerY := float32(windowHeight / 2.0)

	g.canvas.Fill(color.Black)
	g.generateHorizontalAxis()
	g.generateVertialAxis(centerY)
	g.generateWaveform(centerY)
}
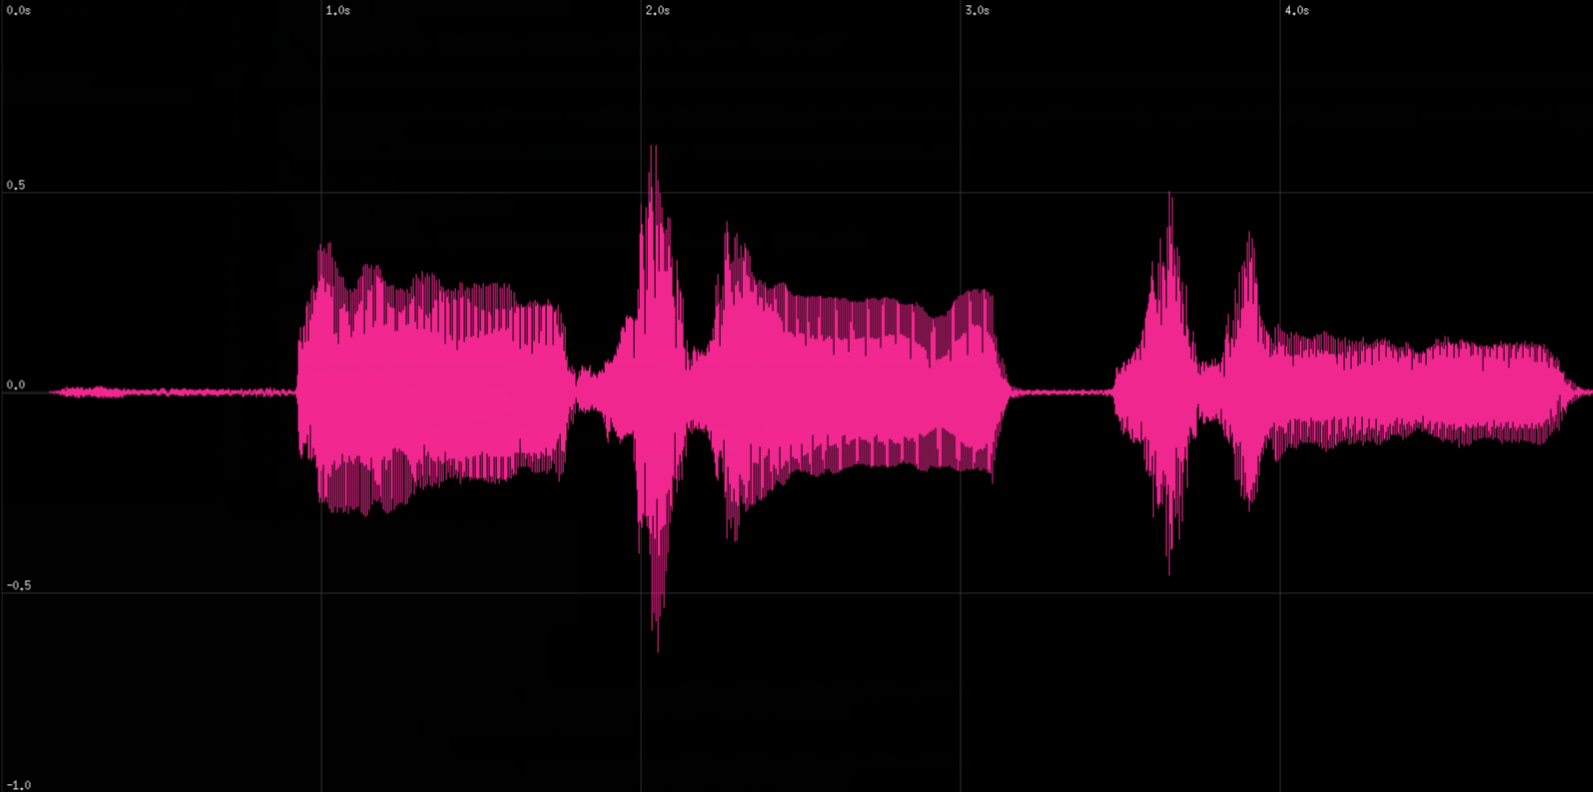
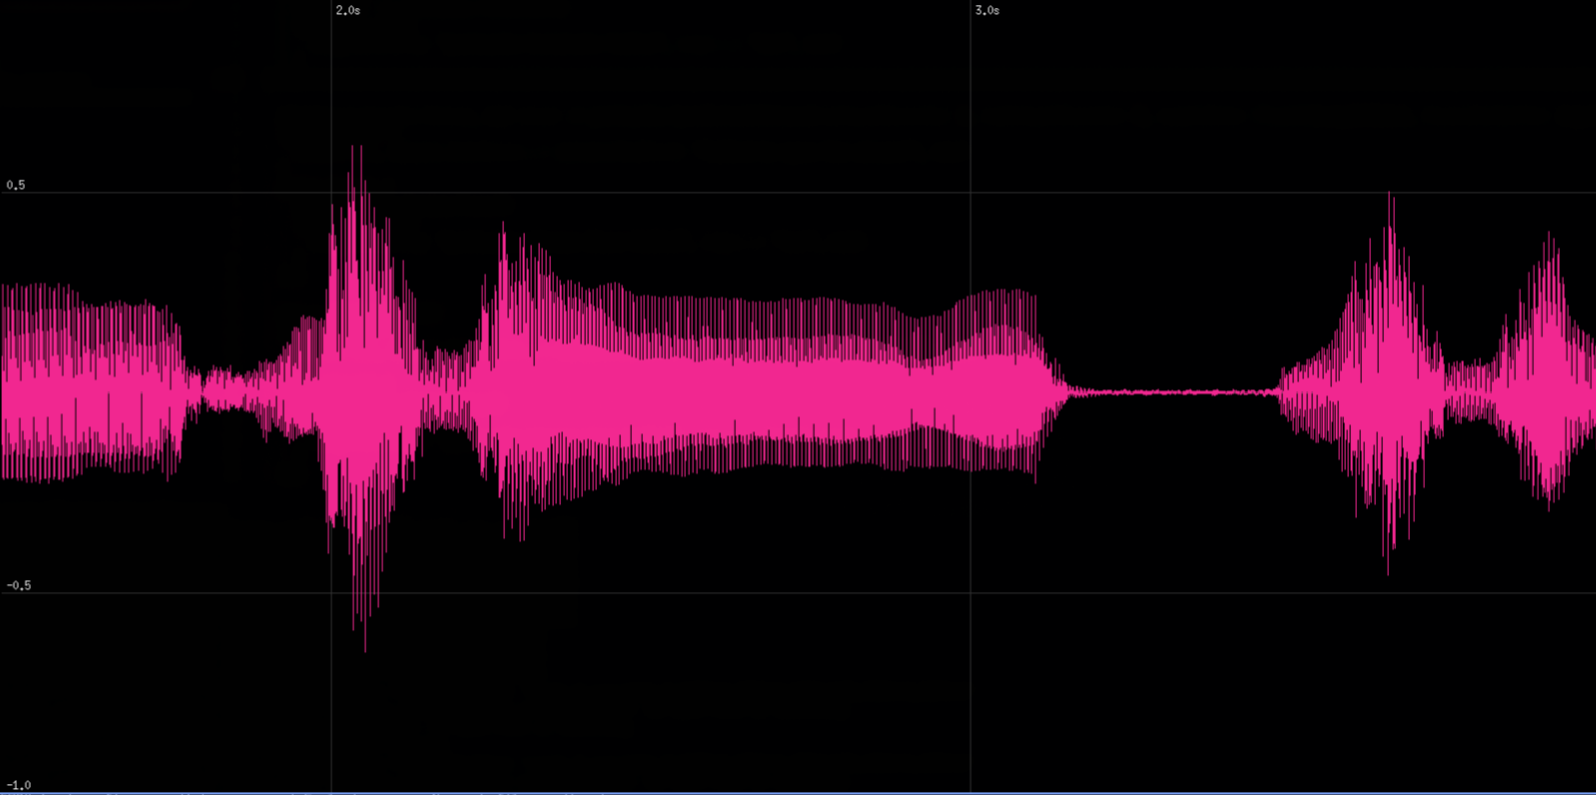
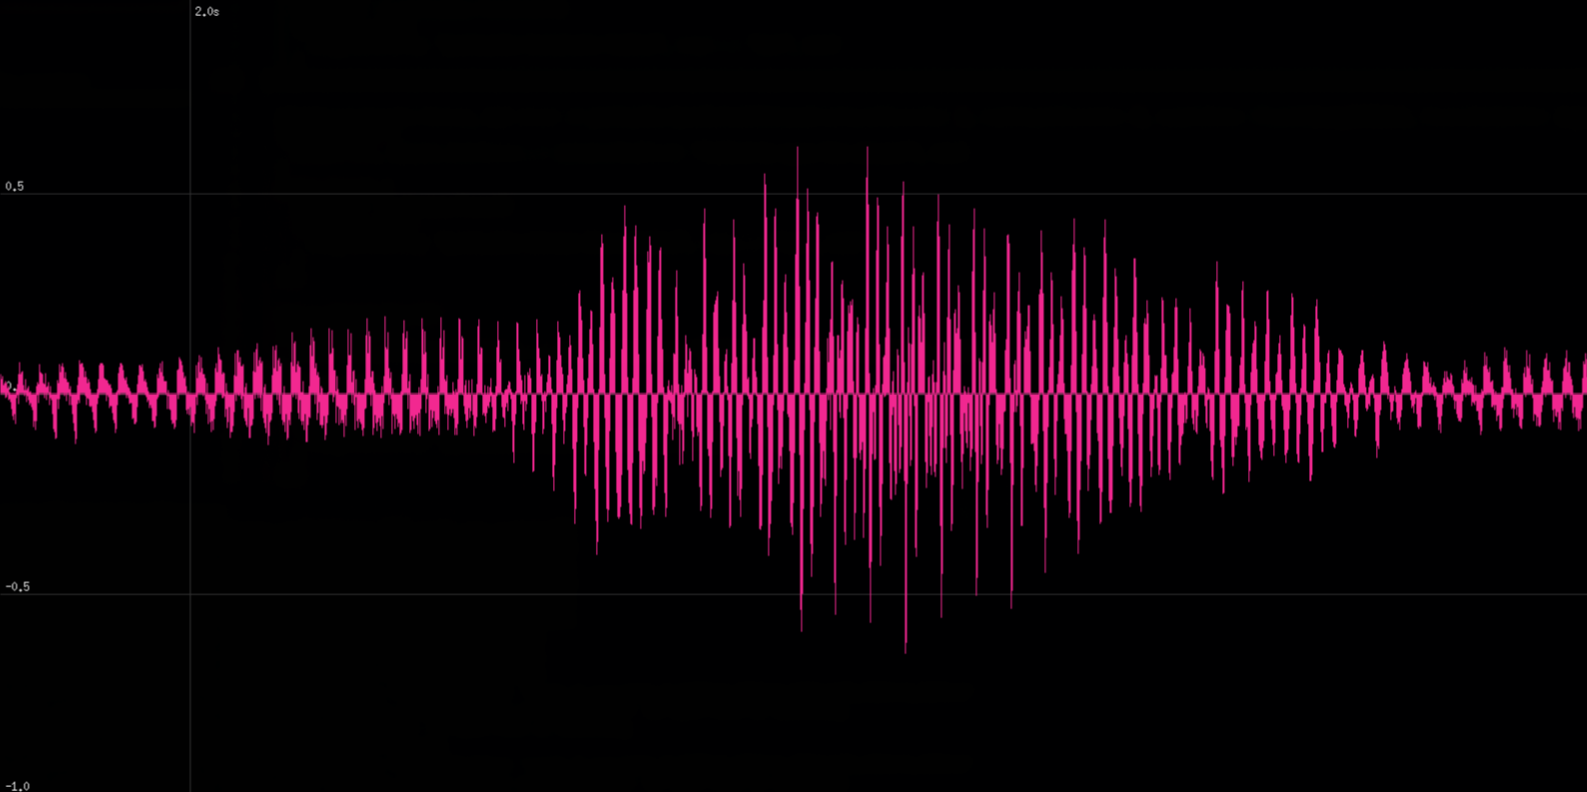
Run go run main.go, record a sound, and use your arrow keys. You can now zoom in to see the exact shape of your audio transients and scroll through time!
Examples:
Zoom 100%
Zoom 200%
Zoom 800%
You can inspect the full source code for this part in the GitHub repository.
In Part 4, we will finally take care of the frequency domain by applying a Fast Fourier Transform (FFT) to our signal. See you then!