Introduction Link to heading
In the first part of this series, we laid the groundwork by recording 5 seconds of audio using PortAudio and saving the raw sample data to a .wav file. While saving to a file verified our recording logic, an oscilloscope needs to give us immediate visual feedback.
In this second part, we will move away from file export and focus on visualization. We will use Ebitengine cross-platform 2D game library for Go to draw our recorded audio samples directly as a waveform.
Our road map for the series looks like this:
- Recording a signal for a fixed amount of time with PortAudio (Done)
- Displaying the waveform of a recorded signal with Ebitengine (You are here)
- Calculating and displaying the spectrum of a recorded signal
- Recording and displaying the signal continuously
Refactoring the Recording Logic Link to heading
Before we dive into drawing graphics, let’s wrap the PortAudio recording logic into a reusable helper function. Instead of dumping raw float slices into a .wav header on disk, RecordWaveform captures sound in memory and returns a slice of []float32.
func RecordWaveform(sampleRate int, recordingDuration time.Duration) ([]float32, error) {
	inputBufferSize := int(recordingDuration.Seconds()) * sampleRate
	inputBuffer := make([]float32, inputBufferSize)

	err := portaudio.Initialize()
	if err != nil {
		return nil, errors.Join(errors.New("failed to initialize portaudio"), err)
	}
	defer func() {
		err := portaudio.Terminate()
		if err != nil {
			slog.Error("portaudio terminate failed", "err", err)
		}
	}()

	stream, err := portaudio.OpenDefaultStream(1, 0, float64(sampleRate), inputBufferSize, inputBuffer)
	if err != nil {
		return nil, errors.Join(errors.New("failed to open the stream"), err)
	}
	defer func() {
		err := stream.Close()
		if err != nil {
			slog.Error("portaudio stream close failed", "err", err)
		}
	}()

	err = stream.Start()
	if err != nil {
		return nil, errors.Join(errors.New("failed to start the stream"), err)
	}
	defer func() {
		err := stream.Stop()
		if err != nil {
			slog.Error("portaudio stream stop failed", "err", err)
		}
	}()

	err = stream.Read()
	if err != nil {
		return nil, errors.Join(errors.New("failed to read stream"), err)
	}

	return inputBuffer, nil
}
Notice the use of explicit deferred functions containing slog.Error checks. Since cleanups in audio drivers can fail, logging teardown failures helps catch subtle hardware resource leaks without hiding the primary function return errors.
Setting Up the Ebitengine Game Loop Link to heading
Ebitengine requires us to implement its ebiten.Game interface, which consists of three methods: Update(), Draw(), and Layout().
const (
	windowWidth  = 1600
	windowHeight = 800
)

type Game struct {
	canvas *ebiten.Image
}

func (g *Game) Update() error {
	return nil
}

func (g *Game) Draw(screen *ebiten.Image) {
	opts := &ebiten.DrawImageOptions{}
	screen.DrawImage(g.canvas, opts)
}

func (g *Game) Layout(outsideWidth, outsideHeight int) (screenWidth, screenHeight int) {
	return windowWidth, windowHeight
}
Since we are rendering a single static buffer for now, we don’t need real-time frame recalculations in Update(). Instead, we pre-render our waveform onto a static canvas image once during initialization and simply draw that canvas onto the active screen inside Draw().
Downsampling and Drawing the Waveform Link to heading
Here comes the core visual problem: At 48 kHz, a 5-second recording gives us 240,000 samples. However, our window is only 1,600 pixels wide.
If we try to plot 240,000 individual points or line segments across 1,600 pixels:
- We waste processing power rendering sub-pixel details.
- Naive point sampling will cause severe aliasing, missing sharp peaks or transients in sound.
To solve this, we downsample the signal into screen-space columns (“buckets”). Each pixel on the X-axis represents a slice of time containing len(samples) / windowWidth audio samples (150 samples per pixel column in our case). For every pixel column, we loop through its corresponding sample slice, locate the minimum and maximum float values, convert them to Y-coordinates, and draw a single vertical line between them using vector.StrokeLine.
func NewGame(samples []float32) (*Game, error) {
	if len(samples) < 2 {
		return nil, errors.New("there must be at least 2 samples")
	}

	canvas := ebiten.NewImage(windowWidth, windowHeight)
	canvas.Fill(color.Black)

	centerY := float32(windowHeight / 2.0)
	step := len(samples) / windowWidth

	for i := 0; i < windowWidth; i++ {
		startX := i * step
		endX := startX + step

		if endX > len(samples) {
			endX = len(samples)
		}

		minY := float32(0.0)
		maxY := float32(0.0)

		for j := startX; j < endX; j++ {
			if minY > samples[j] {
				minY = samples[j]
			}

			if maxY < samples[j] {
				maxY = samples[j]
			}
		}

		// Map [-1.0, 1.0] float range to Y canvas coordinates
		minY = minY*centerY + centerY
		maxY = maxY*centerY + centerY

		vector.StrokeLine(canvas, float32(i), minY, float32(i), maxY, 2.0, color.RGBA{245, 40, 145, 255}, false)
	}

	game := &Game{
		canvas: canvas,
	}

	return game, nil
}
Coordinate Transformation Explained Link to heading
PortAudio normalizes incoming values to the range [-1.0, 1.0]. Screen space in 2D engines places (0,0) at the top-left corner:
centerYrepresents 0 dB amplitude (silence), positioned at 800 / 2 = 400.- extremes of
-1.0and1.0are normalized to window size by multiplying by “center” value and moved by the center value.
Drawing vertical strokes between minY and maxY produces a solid waveform envelope that reveals peaks and transients without visual noise.
Putting It All Together Link to heading
We tie everything together inside DisplayWaveform and main():
func DisplayWaveform(samples []float32) error {
	game, err := NewGame(samples)
	if err != nil {
		return err
	}
	ebiten.SetWindowSize(windowWidth, windowHeight)
	ebiten.SetWindowTitle("waveform")

	err = ebiten.RunGame(game)
	if err != nil {
		return errors.Join(errors.New("error running ebitengine"), err)
	}

	return nil
}

func main() {
	samples, err := RecordWaveform(48*1000, time.Second*5)
	if err != nil {
		slog.Error("error during recording", "err", err)
		return
	}

	err = DisplayWaveform(samples)
	if err != nil {
		slog.Error("error displaying", "err", err)
		return
	}
}
When you run go run main.go, the application records 5 seconds of audio via your microphone and opens a window rendering the entire waveform in vibrant neon pink!
Waveform Example:
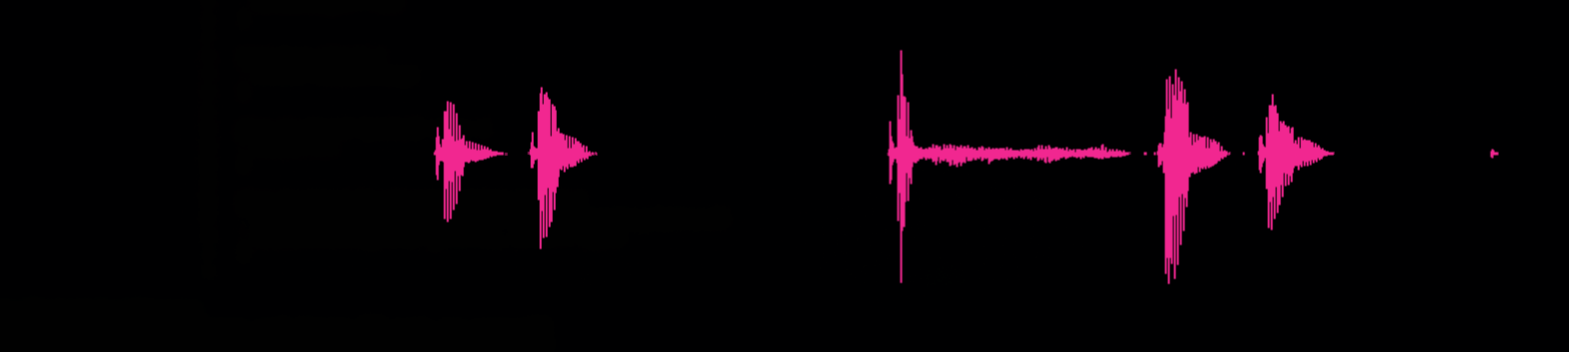
Notice how our waveform is “clipped” on the left side. This is due to the hardware initialization and requesting of a buffer for blocking call. Later we will handle smaller 512sample chunks at the time instead of filling whole buffer of 240k samples.
You can inspect the full source code for this part in the GitHub repository.
In Part 3, we will venture into audio mathematics by applying a Fast Fourier Transform (FFT) to convert our time-domain waveform into a frequency-domain spectrum analyzer. We will also make our waveform interactable by introduction of zoom and scroll.
See you in Part 3!